BoxWatch Review - All-in-One Server Monitoring That Replaces Four Separate Tools
It's 2 AM and your database connection pool just collapsed. The metrics are scattered across one dashboard, uptime alerts live in another, cron failures show up in a third, and process restarts land somewhere else entirely. Each notification goes to a different Slack channel, and each tool needs its own login.
This is the reality of running a modern infrastructure stack. You've assembled Datadog for metrics, Healthchecks.io for cron jobs, UptimeRobot for uptime, and a separate process supervisor—four vendors, four billing cycles, four interfaces, and an endless cycle of context-switching between them.
Why Monitoring Has Become So Complicated
Ask any infrastructure team what the biggest pain point is, and they'll almost always point to fragmentation. Here's what that actually looks like in practice:
- CPU monitoring lives in one tool, uptime monitoring in another, and cron reliability in a third. Piecing together a real picture means jumping between dashboards.
- Monitoring solutions charge per metric, per check, or per server, so every infrastructure change brings a surprise invoice.
- You deploy multiple agents across your fleet, each with its own dependencies and its own failure modes.
- Each tool specializes in one narrow problem, so swapping out any part of the stack means rebuilding the whole thing.
- Alert deduplication rarely works, so you get spammed constantly and real problems get lost in the noise.
For network admins, developers, and security professionals who actually want to solve problems rather than manage vendors, this is a massive waste of time.
What Is BoxWatch? One Agent, One Dashboard, One Bill
BoxWatch takes a fundamentally different approach. Instead of forcing you to choose between separate tools for metrics, cron heartbeats, uptime checks, and process monitoring, it bundles all four into a single platform. That's not a marketing tagline—it's literally what the product does.
The setup is refreshingly simple: install a small open-source bash agent on each server (a single curl command), and it starts collecting everything that matters—CPU, memory, disk, network, and uptime. All of that data flows into one dashboard where you can see your entire fleet at once. One interface, one place to set up alerts, one bill at the end of the month.
The Four Jobs BoxWatch Handles at Once
1. Server Metrics: CPU, Memory, Disk, Network, and Load
BoxWatch tracks the fundamentals: real-time CPU across all cores, RAM consumption patterns that signal when it's time to scale, disk space that warns you days before it fills up, network metrics that surface packet loss, load averages that reveal bottlenecks, and uptime that never lies about restarts.
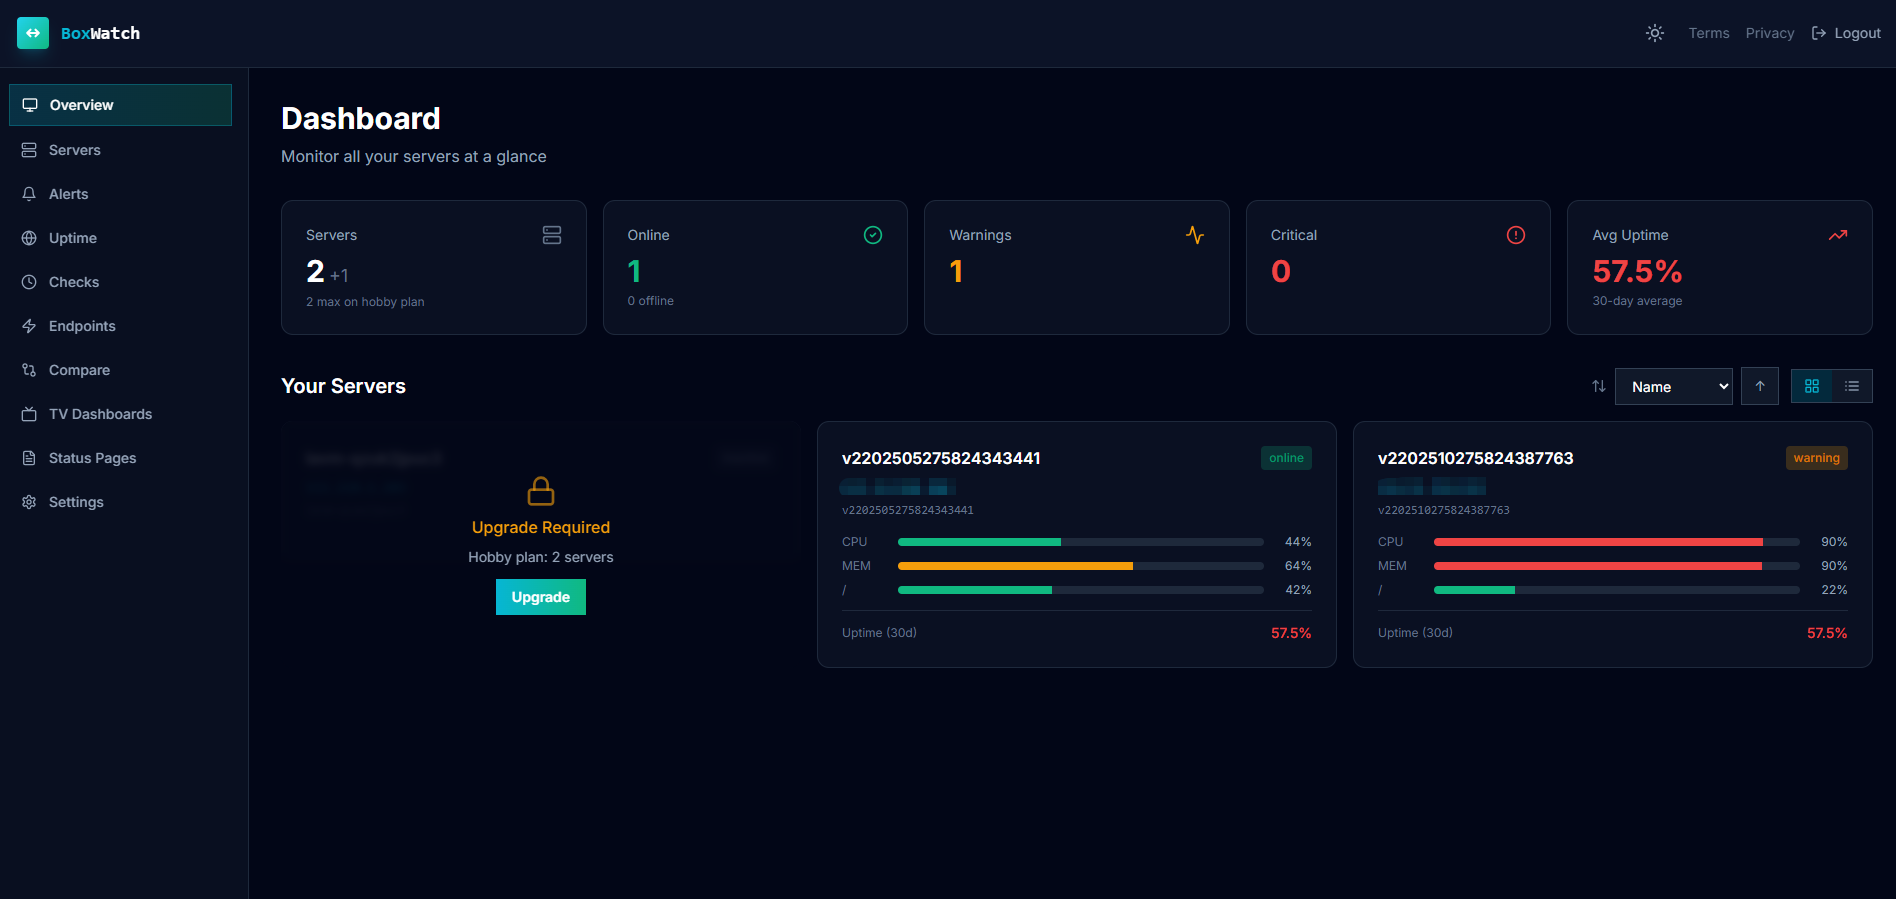
The difference shows up in the monitoring dashboard visualization. Trend charts let you spot patterns over time instead of staring at a single number. Side-by-side server comparisons make it obvious when one box is the outlier. Disk-full predictions give you warnings days before a volume maxes out. This is infrastructure monitoring that actively points you toward what to fix.
2. Cron Heartbeats: Know When Your Jobs Actually Run
Most teams don't realize their nightly backup stopped running until the day they actually need it. Cron heartbeats fix that. You set a cron job to ping a unique URL when it finishes, and BoxWatch starts watching for that ping. Job runs on time? Perfect. Runs late? You're notified. Doesn't run at all? You know that too.
The catch with most cron monitoring is alert fatigue: either you get a notification for every successful job (useless) or nothing until something breaks (dangerous). BoxWatch includes four alert types with transition-based deduplication, so you only get notified when it actually matters.
3. Uptime Checks: HTTP, TCP, and Certificate Expiry
BoxWatch doesn't just hope your endpoints are alive—it actively tests them using the protocols that matter. HTTP probes for web services, TCP checks for databases and caches, and TLS-expiry monitoring so you never get blindsided by an expired certificate.
Here's the key advantage: these checks run from your own deployed BoxWatch agents, not from a centralized hosted service. That means you can monitor internal databases, private APIs, and services sitting behind firewalls. For security professionals and network admins managing infrastructure that doesn't live on the public internet, this is a game-changer.
4. Process Monitoring: When a Critical Service Disappears
Long-running background services often don't crash with error codes. They just... stop. A memory leak, a hung thread, or a dependency timeout later, and your worker is dead while you're asleep.
Process monitoring watches named processes on each server. When one disappears or unexpectedly restarts, you're notified. No custom supervisor scripts, no guessing—just clear visibility into whether your critical services are actually running.
Features Beyond the Four Core Jobs
Alerts That Don't Drive You Insane
- Email, Slack, and Discord alerts: pick what your team already uses.
- Webhook integration sends alerts to PagerDuty, Zapier, n8n, or any custom system.
- Smart cooldowns prevent notification spam when things self-recover.
- Recovery notifications tell you when problems are actually fixed.
- Maintenance windows let you suppress alerts during planned downtime.
Status Pages and SLA Tracking
Branded status pages show your customers infrastructure health without revealing internal details. Incident logging keeps a timeline of what happened and when. Track uptime SLA compliance across 24-hour, 7-day, 30-day, and 90-day windows. Weekly digest emails summarize what actually happened, and monthly detailed reports provide context for capacity planning.
Enterprise Features You Might Actually Use
TV dashboard mode for wall displays, 2FA for account security, scoped API keys so third-party integrations can't access everything, and Stripe self-service billing that just works.
The Open-Source Advantage
The bash agent is public on GitHub. You can read every line before deploying to production—no black-box surprises. Installation is a single curl | bash command, taking roughly 60 seconds from zero to monitoring. The webhook-native architecture means you're not locked into proprietary APIs.
Pricing: What You Actually Pay
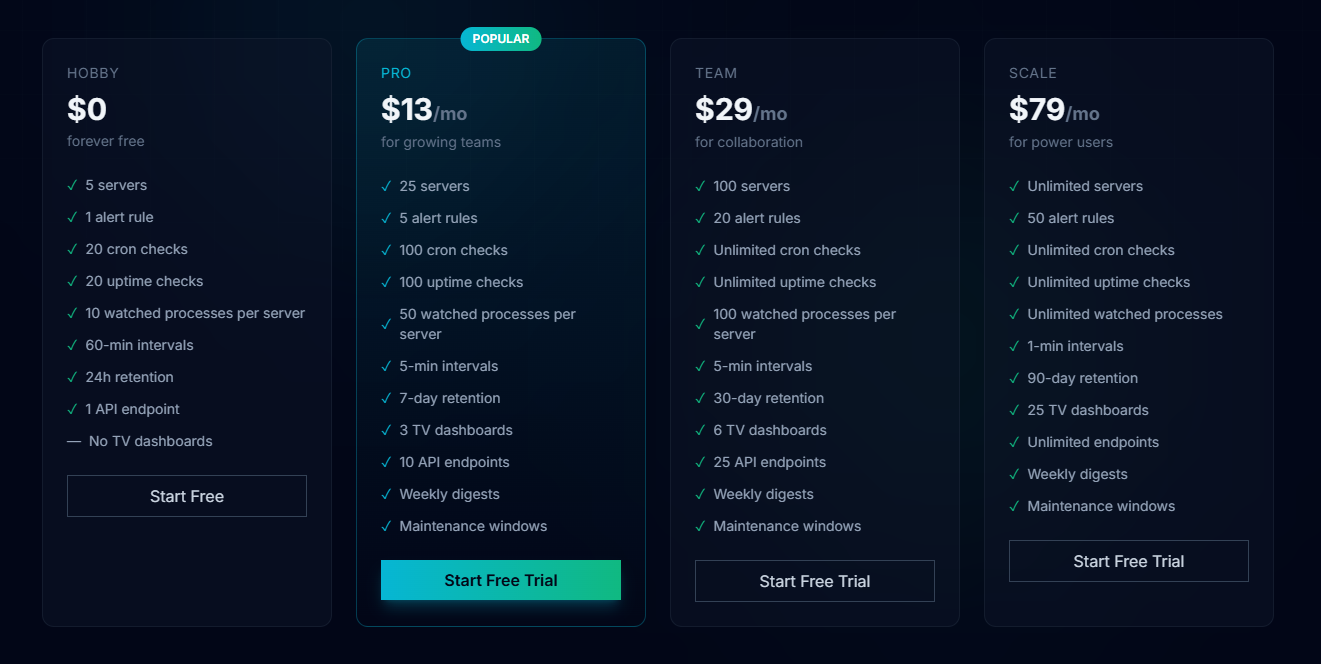
No per-metric charges. No surprise fees. Here's what you get:
- Hobby: Free forever. 5 servers, 1 alert rule, basic monitoring. Great for side projects and learning.
- Pro: $13/month for 25 servers. 5 alert rules, 5-min check intervals, 7-day retention, 3 TV dashboards, weekly digests.
- Team: $29/month for 100 servers. Unlimited cron and uptime checks, 30-day retention, 6 TV dashboards, maintenance windows.
- Scale: $79/month for unlimited servers. 50 alert rules, 1-min intervals, 90-day retention, 25 TV dashboards, unlimited API endpoints.
Every tier includes metrics monitoring, cron heartbeats, uptime checks, process monitoring, and alerts. You're not paying for a "metrics monitoring" tier and then getting upsold on "uptime monitoring." It's all there from the start.
If you've been burned by Datadog's per-metric pricing model, this flat-rate structure is genuinely refreshing.
BoxWatch vs. The Frankenstein Stack
Most teams assemble monitoring from whatever's cheapest or most familiar:
| What | DIY Approach | BoxWatch |
|---|---|---|
| Metrics | Datadog (expensive, per-metric) | Included |
| Cron monitoring | Healthchecks.io | Built-in |
| Uptime checks | UptimeRobot | Built-in, includes internal networks |
| Process watching | Supervisord or custom scripts | Built-in |
| Dashboards | Four separate logins | One interface |
| Alerts | Different channels per platform | Email/Slack/Discord/webhooks, all in one place |
| Pricing | Unpredictable (per-metric stacking) | Flat per-server, no surprises |
| Setup overhead | Multiple agents, multiple dependencies | One lightweight bash agent |
| Internal network monitoring | Can't reach behind firewalls | Works with deployed agents |
| Time to understand what happened | Switch between platforms, lose context | One place to look |
The comparison is almost unfair. BoxWatch consolidates what normally requires stitching together four separate vendors.
Who Should Actually Use BoxWatch
Network admins managing production infrastructure: If you're keeping dozens or hundreds of servers running, you don't want to context-switch between four platforms to answer basic questions. One dashboard for CPU, memory, disk, and network metrics means faster incident response.
Development teams shipping production apps: Developers need to know when services fail, when cron jobs don't run, when disk fills up. BoxWatch covers all three without forcing the team to juggle multiple logins and alert channels.
Security professionals on private networks: Unlike hosted uptime services that can't reach behind firewalls, BoxWatch's agent-based architecture lets you monitor internal databases, cache layers, and replication streams—the infrastructure that actually matters to security.
Teams burned by surprise bills: Per-metric billing scales in ways you don't expect. BoxWatch's flat-rate pricing means you know exactly what you'll pay, and adding more servers doesn't trigger sticker shock.
Organizations that care about code visibility: The open-source agent means you're not deploying unknown software to your infrastructure. You can read the code, understand what it collects, audit it, and fork it if needed.
What BoxWatch Is Not
It's worth being clear about scope:
- Not an APM tool: BoxWatch monitors infrastructure—CPU, memory, disk, network, uptime, processes. It doesn't trace individual requests through application code like New Relic or Datadog APM.
- Not a log aggregation platform: For centralized log management, you'll still need a separate solution like ELK or Datadog Logs.
- Not a full observability platform: It covers infrastructure monitoring exceptionally well, but doesn't include distributed tracing or complex analytics.
- Not for teams needing massive custom metrics: Per-server pricing means it's not the right choice if you need thousands of custom metrics per server.
This honesty about scope is refreshing. BoxWatch does four things better than four separate tools; it doesn't pretend to do everything.
The Real Value: Simplicity Without Compromising Power
The most valuable thing BoxWatch offers might not be a single feature. It's the elimination of complexity.
Instead of maintaining integrations between four platforms, managing four separate alert configurations, and teaching your team to navigate four different dashboards, you have one source of truth for infrastructure health.
This is what unified server monitoring actually looks like: comprehensive coverage without the cognitive load.
For teams managing production infrastructure, that simplicity translates directly into faster incident response. When a disk is filling up, a process crashes, or a cron job misses its window, you're notified through channels your team already uses—Slack, Discord, email, PagerDuty. You see the alert, understand the context immediately because it's all in one dashboard, and respond accordingly.
No context switching. No hunting through multiple interfaces. Just clear, actionable information.
The Bottom Line
BoxWatch is built for people who are sick of managing vendors instead of infrastructure. It does exactly what it promises: consolidates four separate tools into one platform with one dashboard and one bill.
If you've been managing Datadog + Healthchecks + UptimeRobot + Supervisord and you're tired of it, this platform actually solves that problem. Not theoretically. Actually.
Don't let infrastructure complexity slow you down. BoxWatch brings simplicity to server monitoring with one agent that does the job of four tools, transparent pricing, and an open-source codebase you can audit. Start monitoring in 60 seconds.
👉 Sign up for Free — no credit card required.
Tags
# Review# BoxWatch# server monitoring# server monitoring tool# server metrics# monitoring dashboard# uptime monitoring# metrics monitoring# CPU monitoring# network monitoring# disk monitoring# process monitoring# cron monitoring# cron heartbeats# uptime checks# HTTP monitoring# TCP monitoring# TLS monitoring# server health monitoring# infrastructure monitoring# application monitoring# system monitoring# performance monitoring# real-time monitoring# alert management# network admin tools# server management# DevOps monitoring# monitoring solution# unified monitoring# open source monitoring# bash agent# Datadog alternative# monitoring tool comparison# server uptime# system health check# disk space monitoring# memory monitoring# load monitoring# status page# incident management# monitoring alerts# Slack alerts# Discord alerts# webhook monitoring# PagerDuty integration# affordable monitoring# monitoring for startups# server monitoring free# monitoring dashboard design# multi-region monitoring# maintenance windows# SLA tracking# uptime reporting# monitoring metricsCashwerk Review - Smart Invoicing and Business Tools for Freelancers and Creators
Axo Analytics Review - Privacy Focused Website Analytics Without Cookies
Follow for new blogs
Subscribe to our blog
Subscribe to Newsletter
Subscribe to our newsletter to get the best products weekly.